
Data-driven opening: define the question
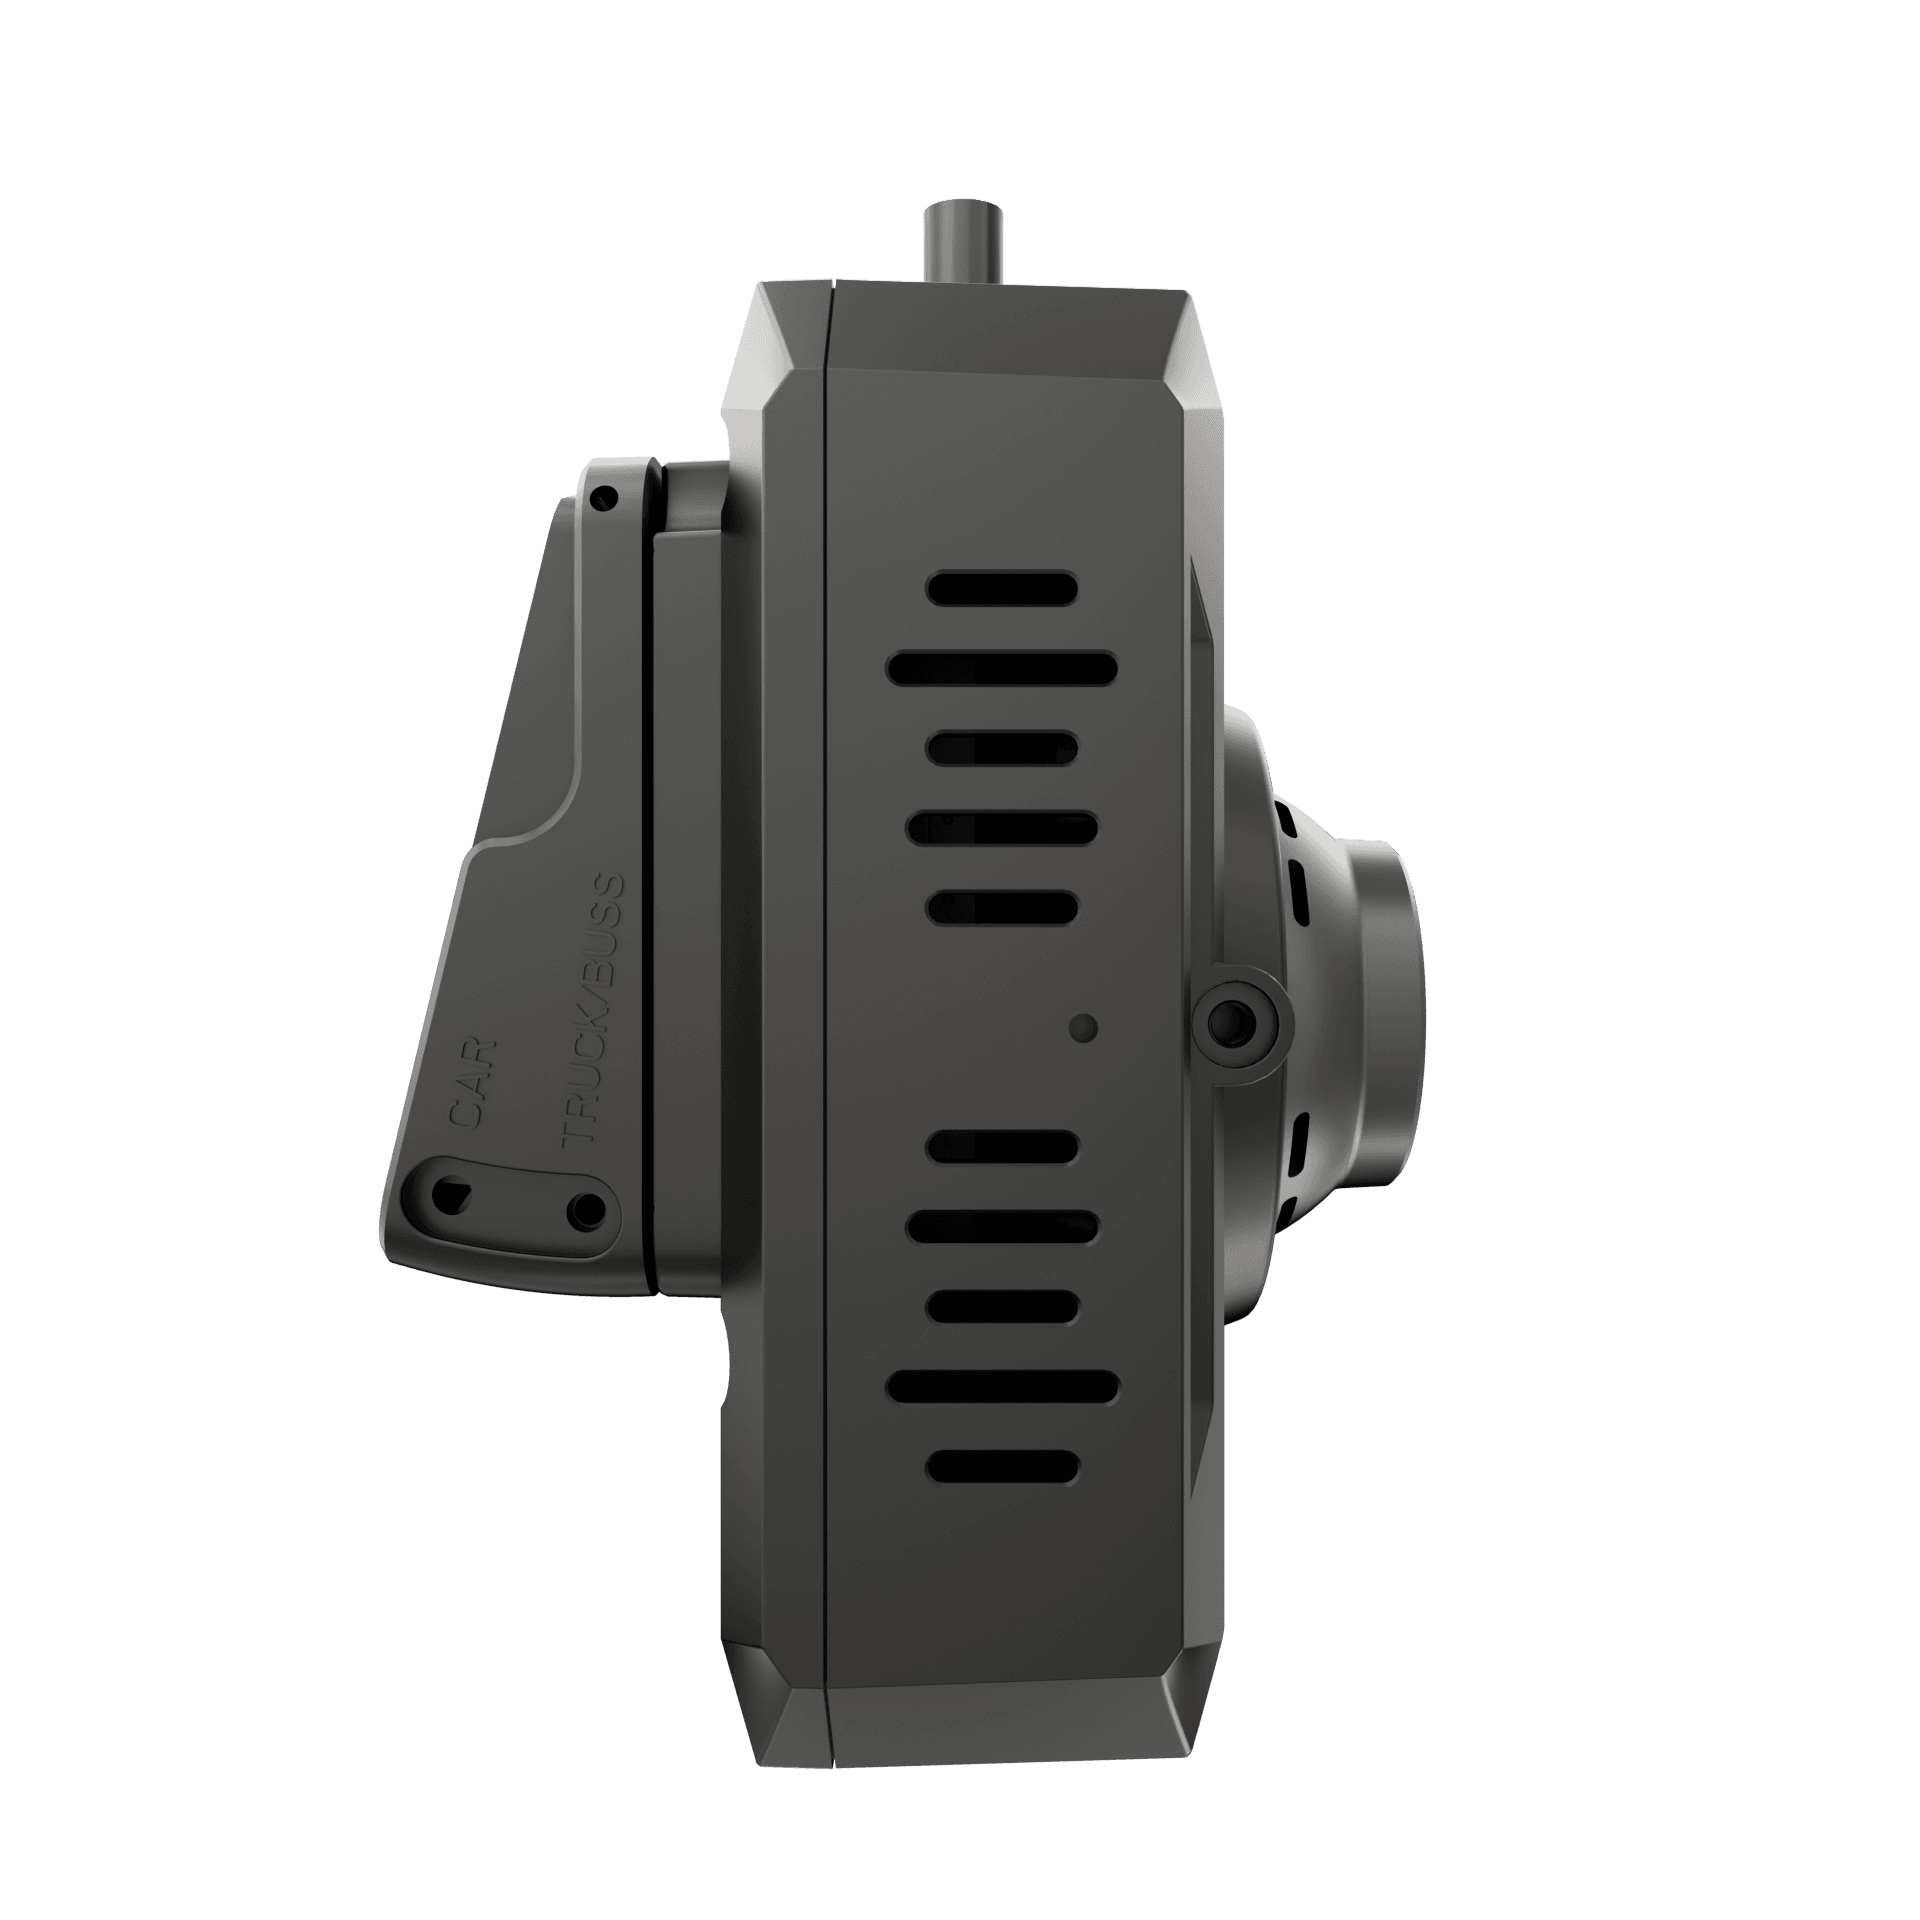
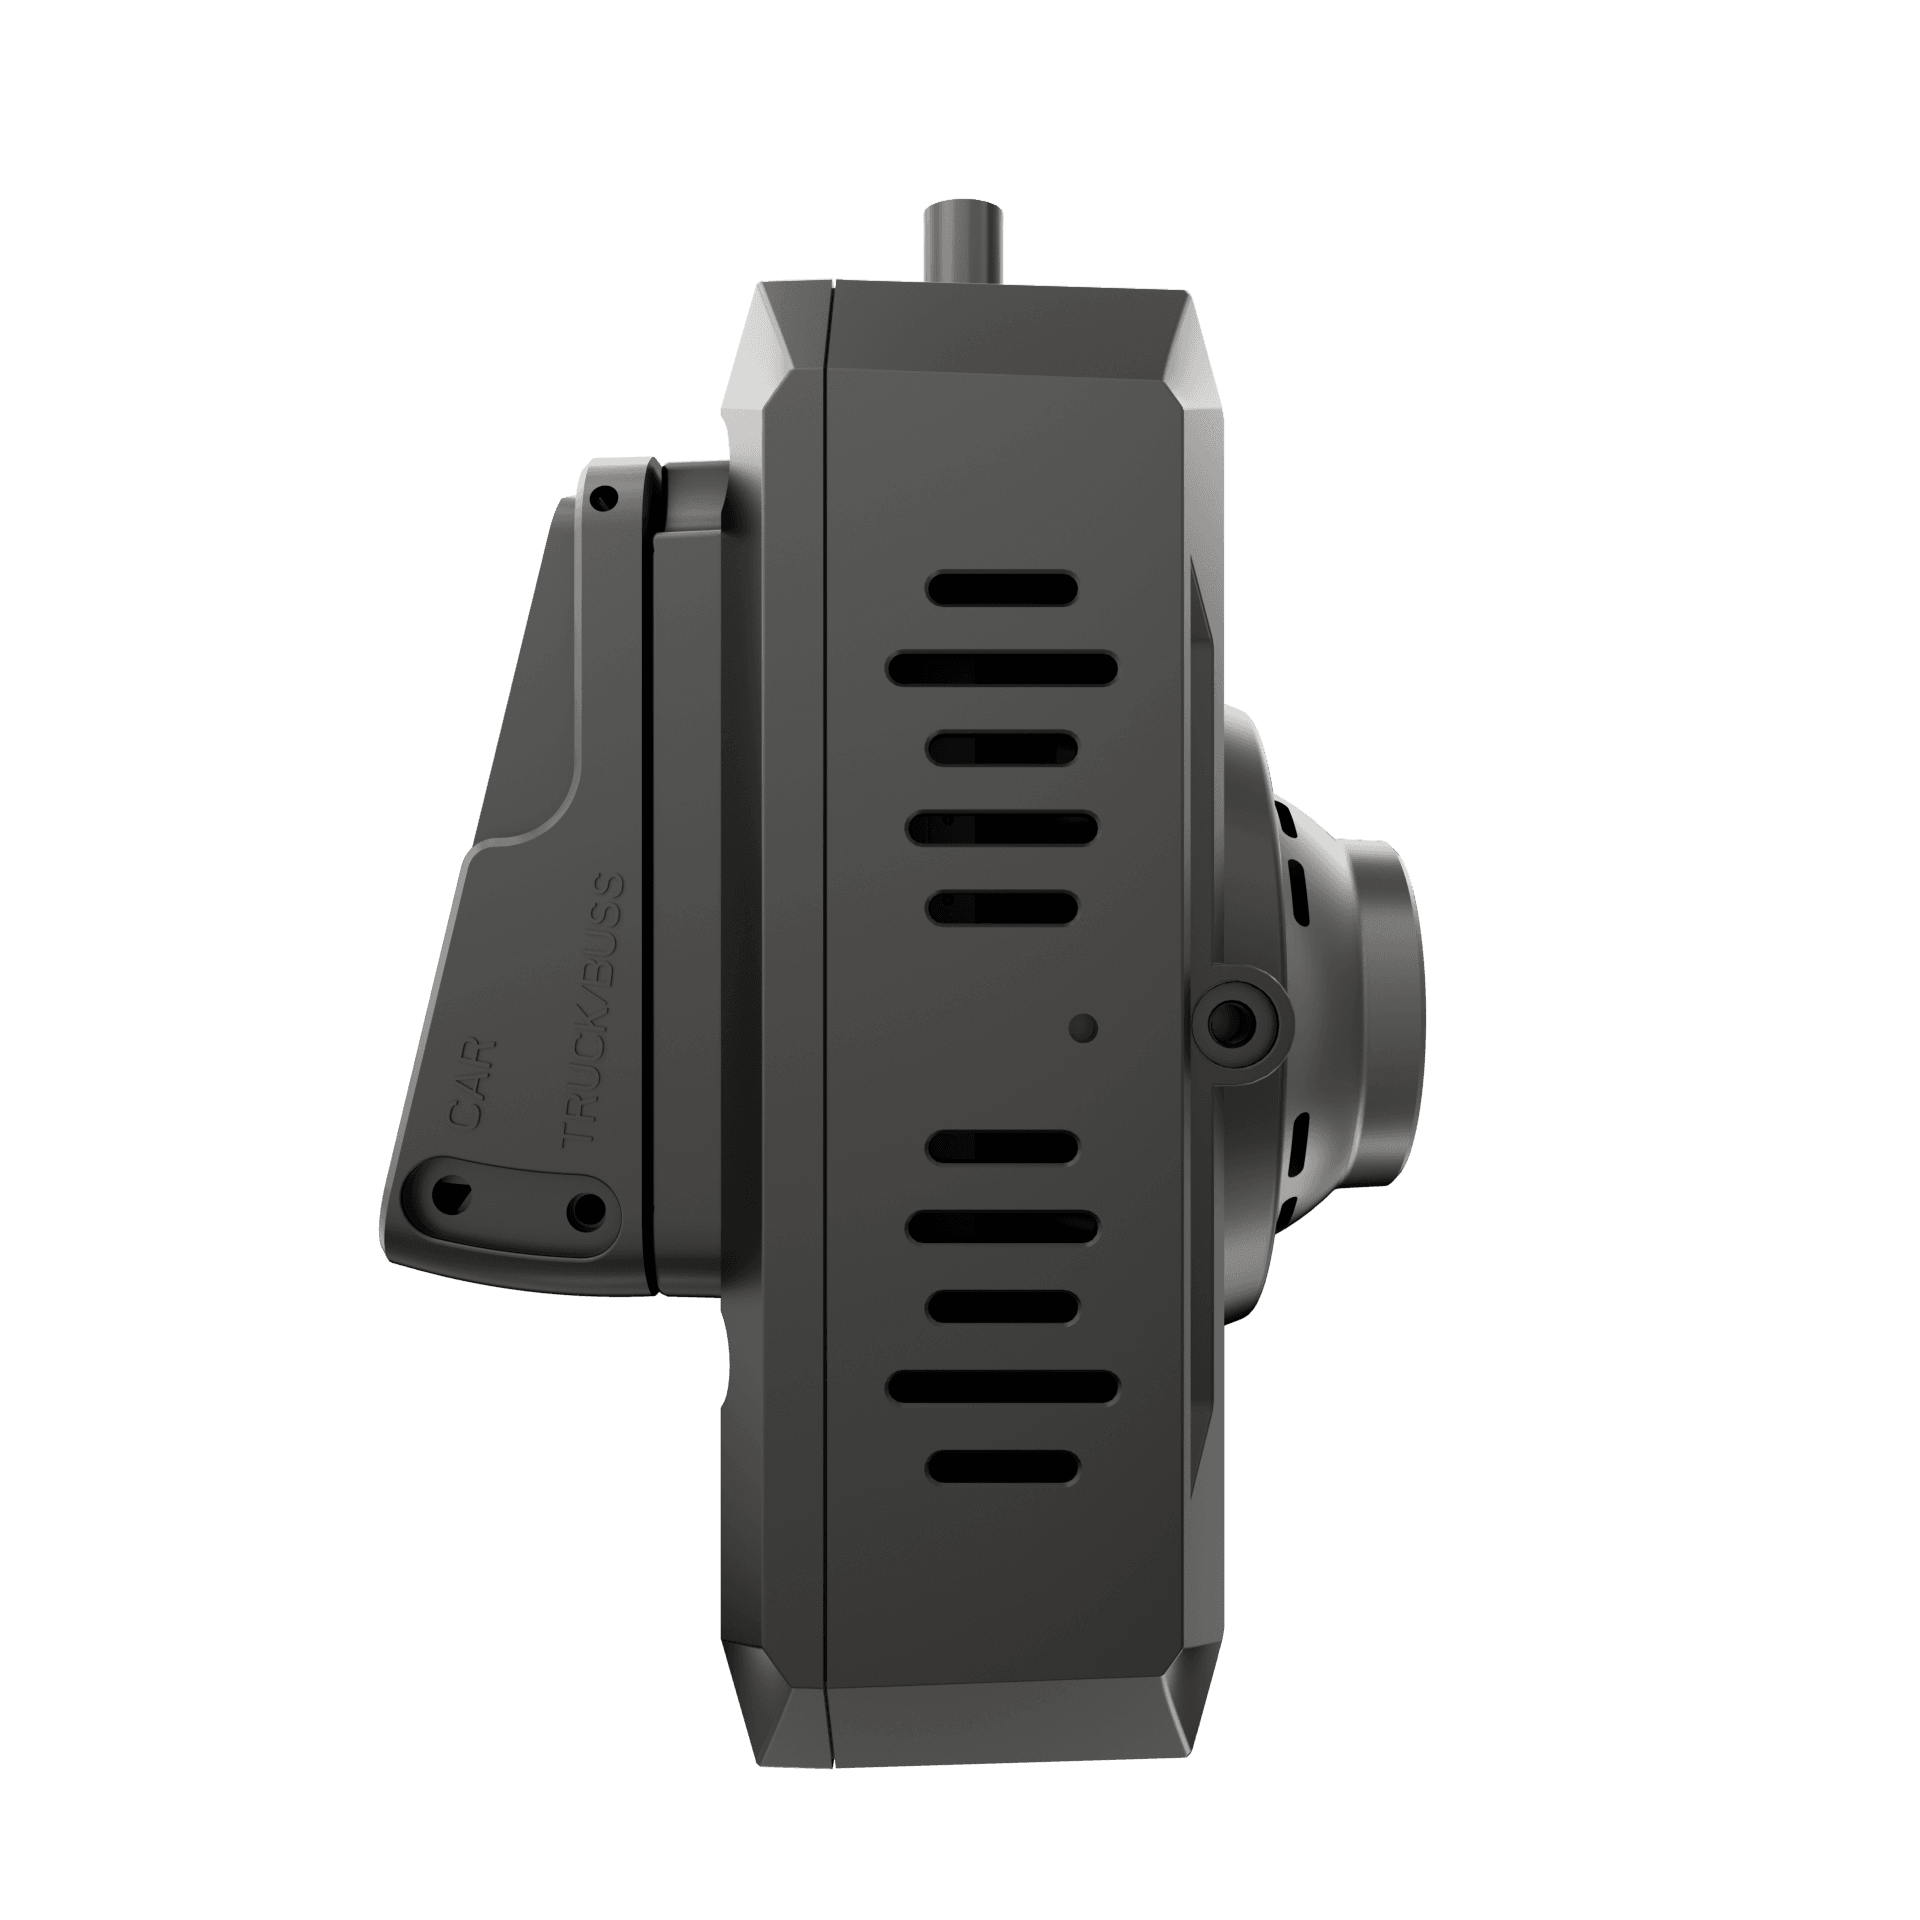
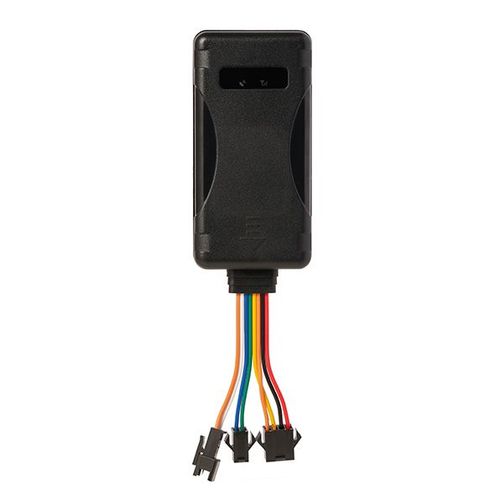
Start with measurable outcomes: reduced operating cost per route, fewer preventable incidents, on-time performance, and lower total cost of ownership. Concrete measurement depends on reliable inputs from both fleet telematics systems and observational hardware—pairing fleet telematics technology providers and a trusted fleet camera manufacturer delivers the raw signals you need. Practical evidence of these linked systems surfaced at CES 2023, where integrated camera-and-telematics demonstrations clarified what consistent, timestamped data looks like in real operations.
Key KPIs to track
Choose metrics that tie directly to dollars or risk exposure. Track these continuously:- Cost per mile and cost per service hour.- Incidents per 100,000 miles and cost-per-incident (repairs, legal, lost service).- Preventable collision rate and related claim spend.- Fuel consumption per route and idle time.- Driver turnover and training hours per driver.- On-time pickups percentage and route utilization.These KPIs convert operational changes into financial impact when collected reliably over a 12–36 month baseline.
Framework for calculating ROI
Break ROI into sensible buckets: initial investment, recurring costs, quantifiable benefits, and payback period. Use this formula:- Investment = hardware + software licenses + integration + training + rollout labor.- Annual recurring = connectivity + maintenance + SaaS + replacement reserve.- Quantified annual benefits = avoided repairs/claims + fuel savings + labor efficiency + reimbursement or funding gains + reduced downtime.Payback period = Investment / Annual Quantified Benefits. Express ROI as (Annual Benefits − Annual Recurring) / Investment for year-one perspective, then model NPV for multi-year decisions.
Example calculation (illustrative)
Use conservative, labeled assumptions to avoid overstating results. Example:- Investment: $200,000 for 50 buses (cameras, telematics, installation, training).- Annual recurring: $40,000.- Measurable annual benefits: $60,000 (reduced claims $30k, fuel savings $15k, labor/route efficiency $15k).- Year-one net benefit = $60k − $40k = $20k; payback ≈ 10 years; simple ROI (year one) = 10%.Model multi-year improvements: if claims drop further after year two, NPV and ROI improve materially. Always run sensitivity scenarios (±20% on benefits and recurring costs) to see risk ranges.
Operational value beyond headline ROI
Monetary ROI misses several operational gains you should quantify qualitatively or assign conservative dollar values to:- Risk reduction: fewer severe incidents lowers long-term insurance premiums.- Compliance and auditability: automated logs reduce administrative overhead.- Parental trust and incident transparency: reduces reputational costs and political friction.- Driver coaching productivity: recorded events accelerate training and retention.Assign weights to these factors in procurement scoring—they often justify investments even when strict financial payback is slow.
Vendor evaluation criteria
Assess vendors on data fidelity, integration, and support:- Data fidelity: timestamp accuracy, event markers, and secure storage.- Interoperability: open APIs, standard protocol support, and exportable raw data for analysis.- Scalability: single-bus proofs should scale to district-wide deployment without redesigning workflows.- Service model: uptime SLAs, update cadence, and local support for rollouts.- Privacy and compliance: clear data retention and student privacy controls.Require a short pilot contract with defined success metrics and an exit path.
Common pitfalls and mistakes
Avoid these recurring errors:- Treating pilot success as full-deployment certainty; performance often degrades at scale.- Overlooking total cost of ownership (connectivity and replacement reserve).- Relying solely on vendor dashboards without validating raw feeds.- Ignoring change management—drivers, dispatch, and parents must get practical, simple workflows.- Setting unrealistically short payback expectations without modeling multi-year benefits.
Deployment checklist
Before signing, confirm:- Baseline KPI collection for 12 months.- Clear success criteria and measurement cadence.- Integration plan with back-office systems and dispatch.- Training plan with retraining windows and performance coaching.- Data governance policy tied to student privacy and retention timelines.- Budget for phased rollout and an unambiguous decommission plan for legacy devices.
Final synthesis
A disciplined, data-driven evaluation converts technical capability into financial and operational decisions. Use rigorous KPIs, model conservative scenarios, require interoperable hardware and software, and plan for behavior change during rollout. When field-proven camera and telematics data feed consistent analytics and coaching, you get measurable reductions in claims, improved service reliability, and clearer evidence for long-term investment decisions—outcomes I’ve seen translate to durable value for large school systems partnering with BSJ.